Client: Toitū Te Waiora Workforce Development Council
2025
Data Visualisation, Information and Publication Design
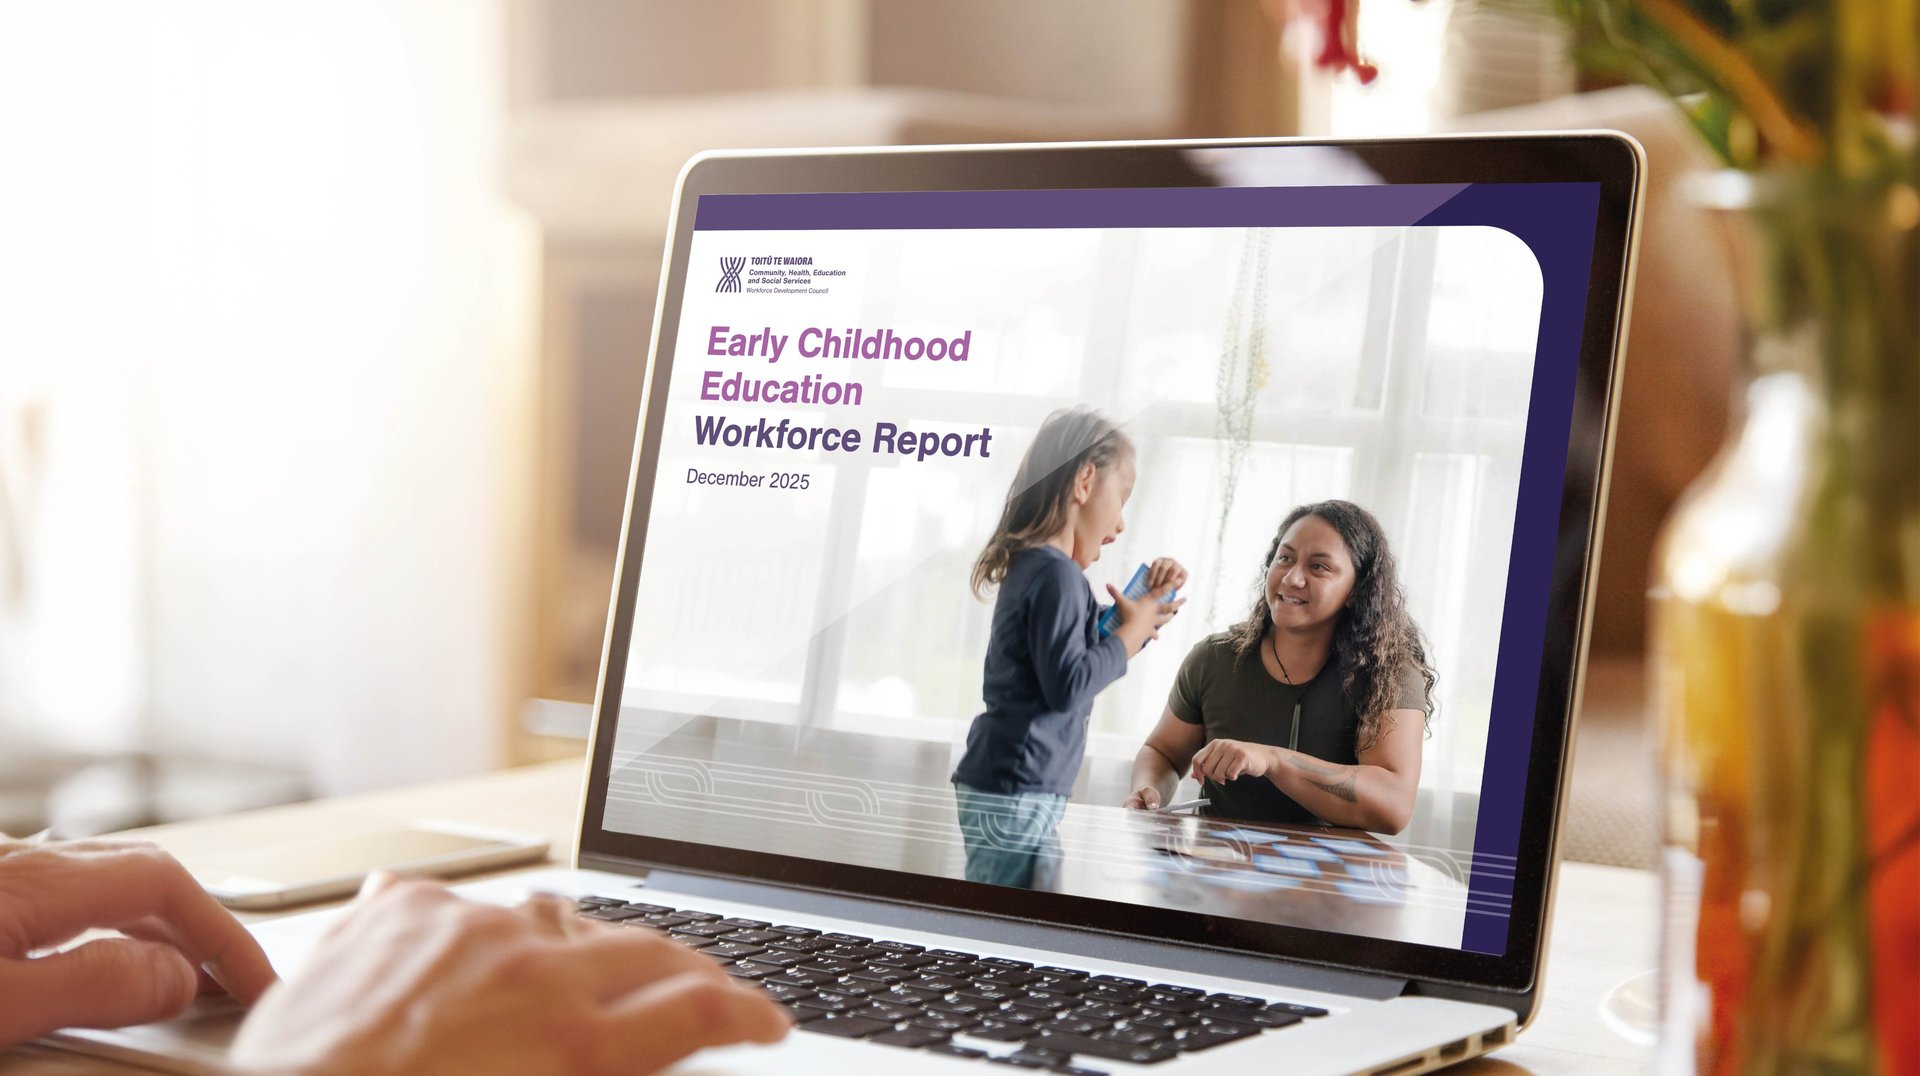
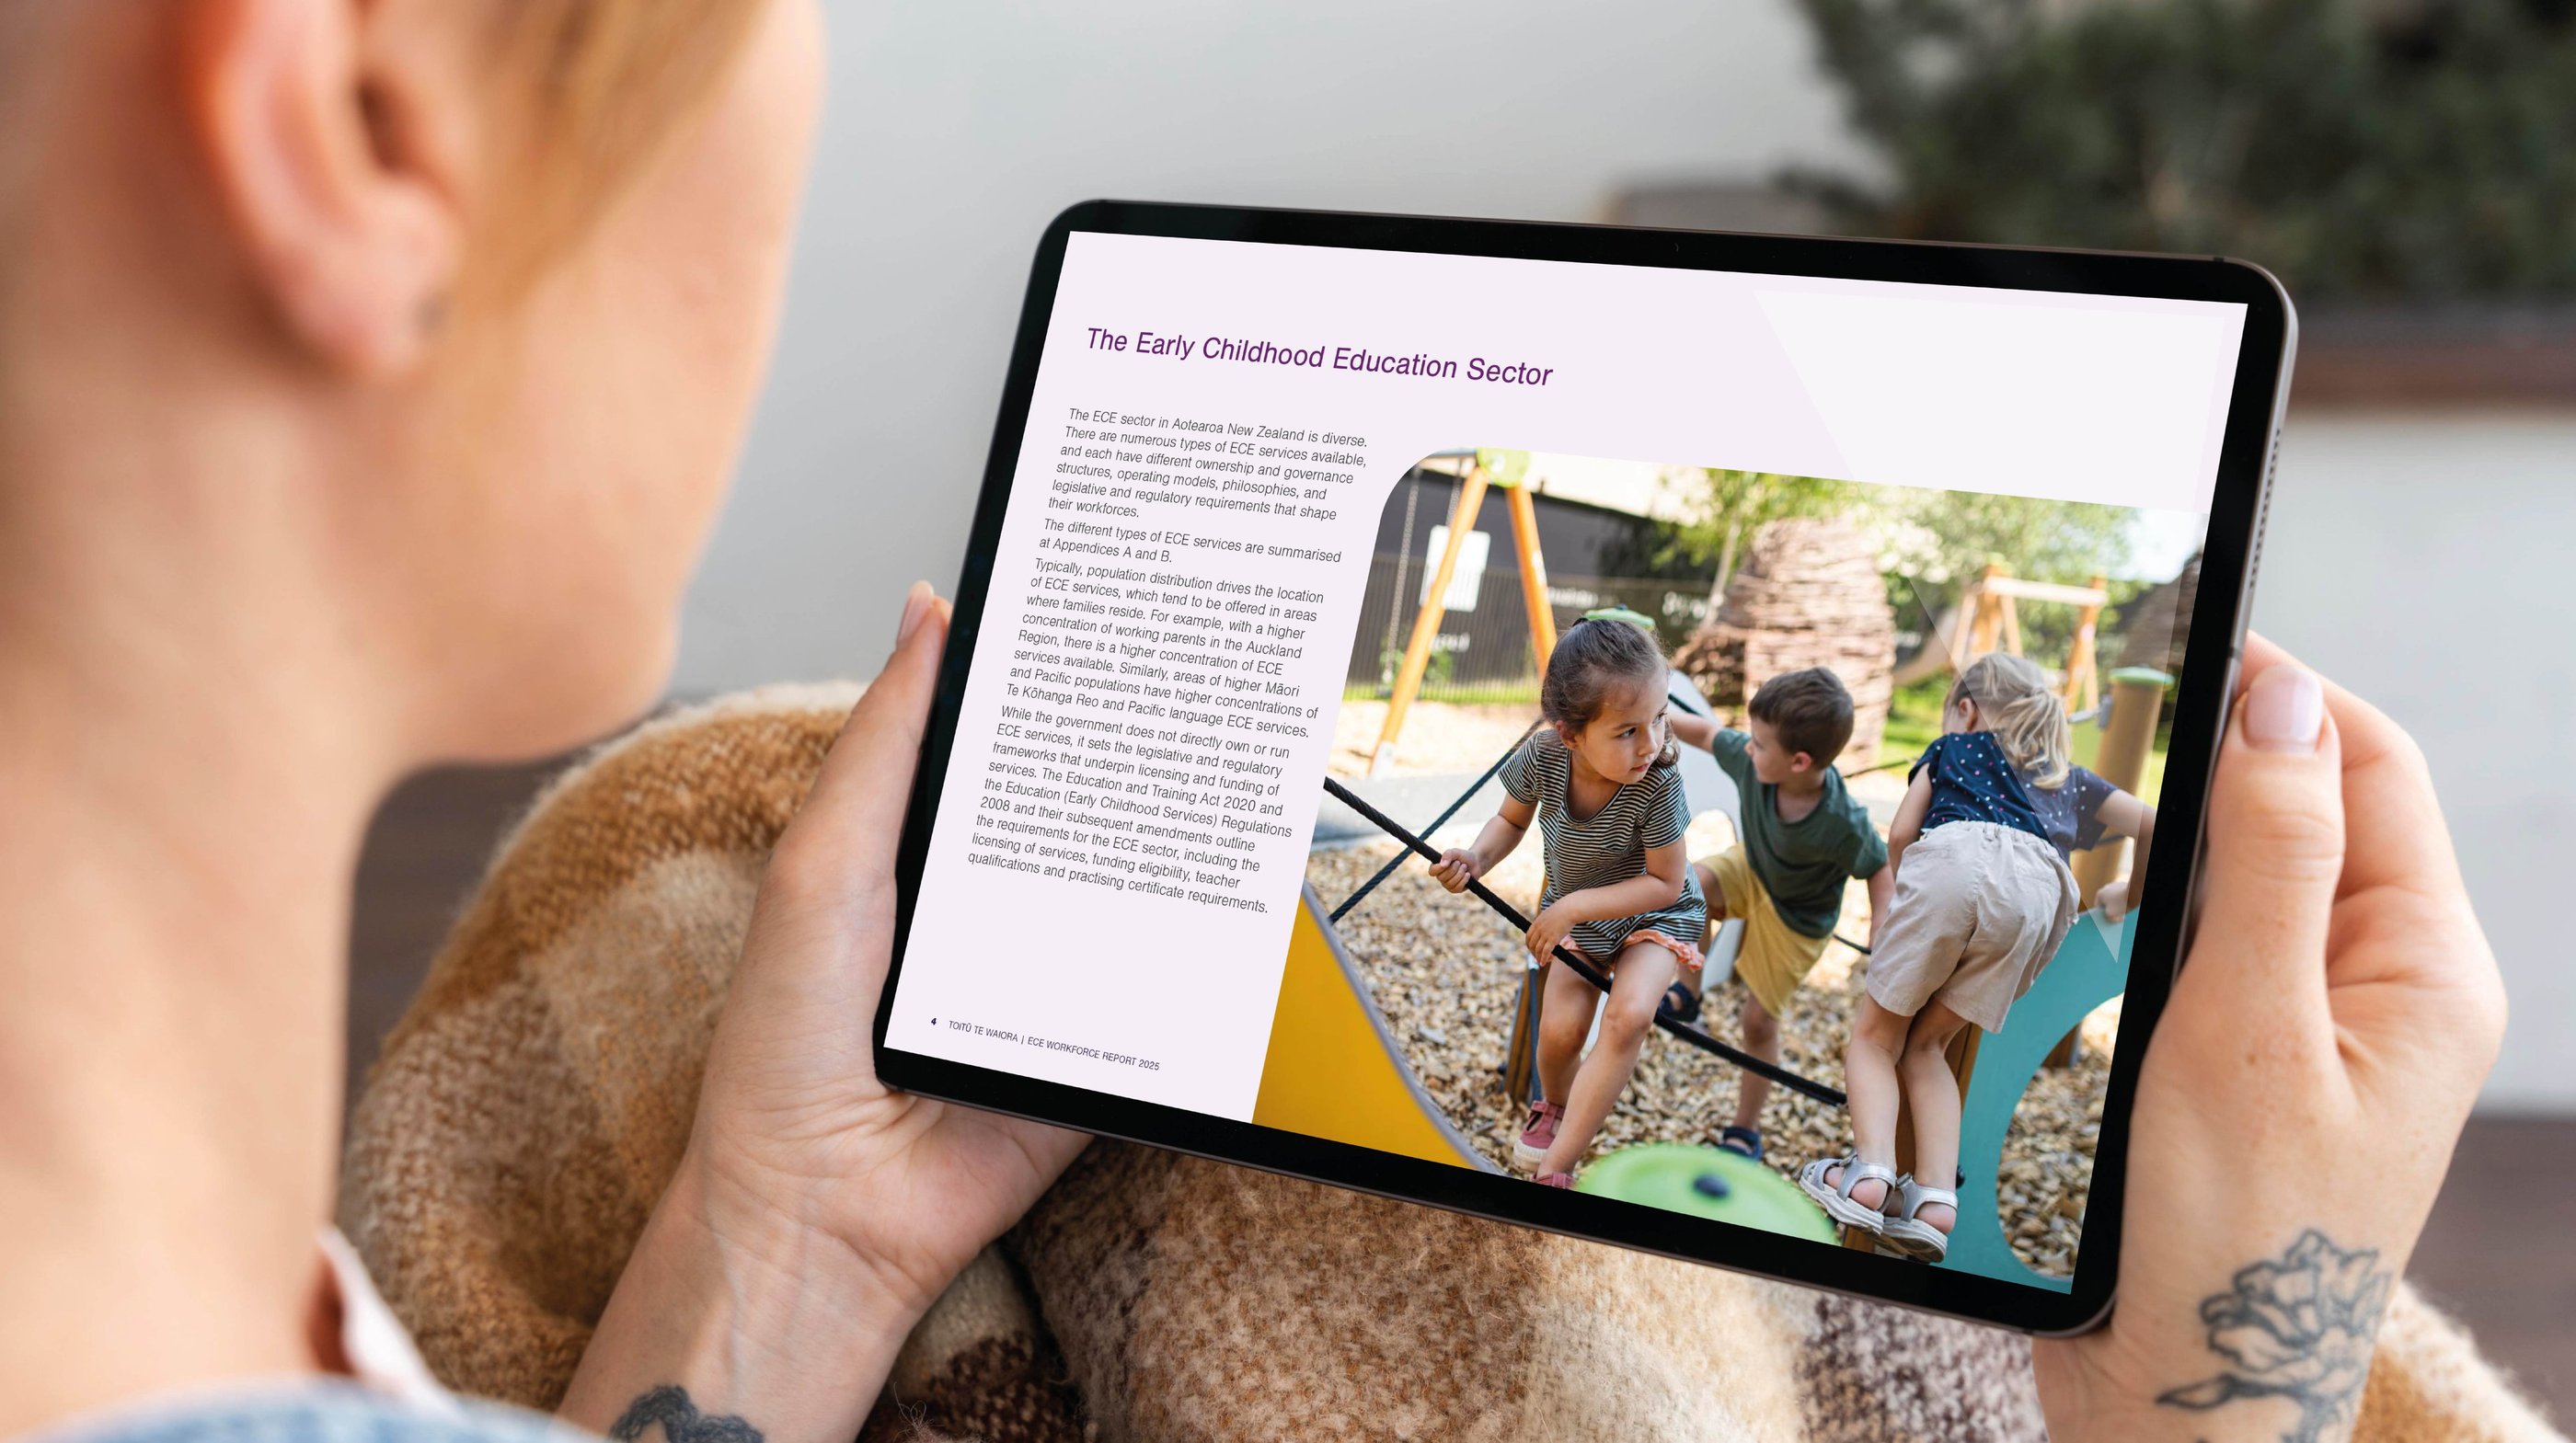
Early Childhood Education Workforce Report
Understanding and visualising complex data sets for easy communication.
Toitū Te Waiora was a workforce development council who helped improve community, health, education and social services sectors in Aotearoa. This involved identifying the skillsets that are needed and supporting standards setting and qualifications development.
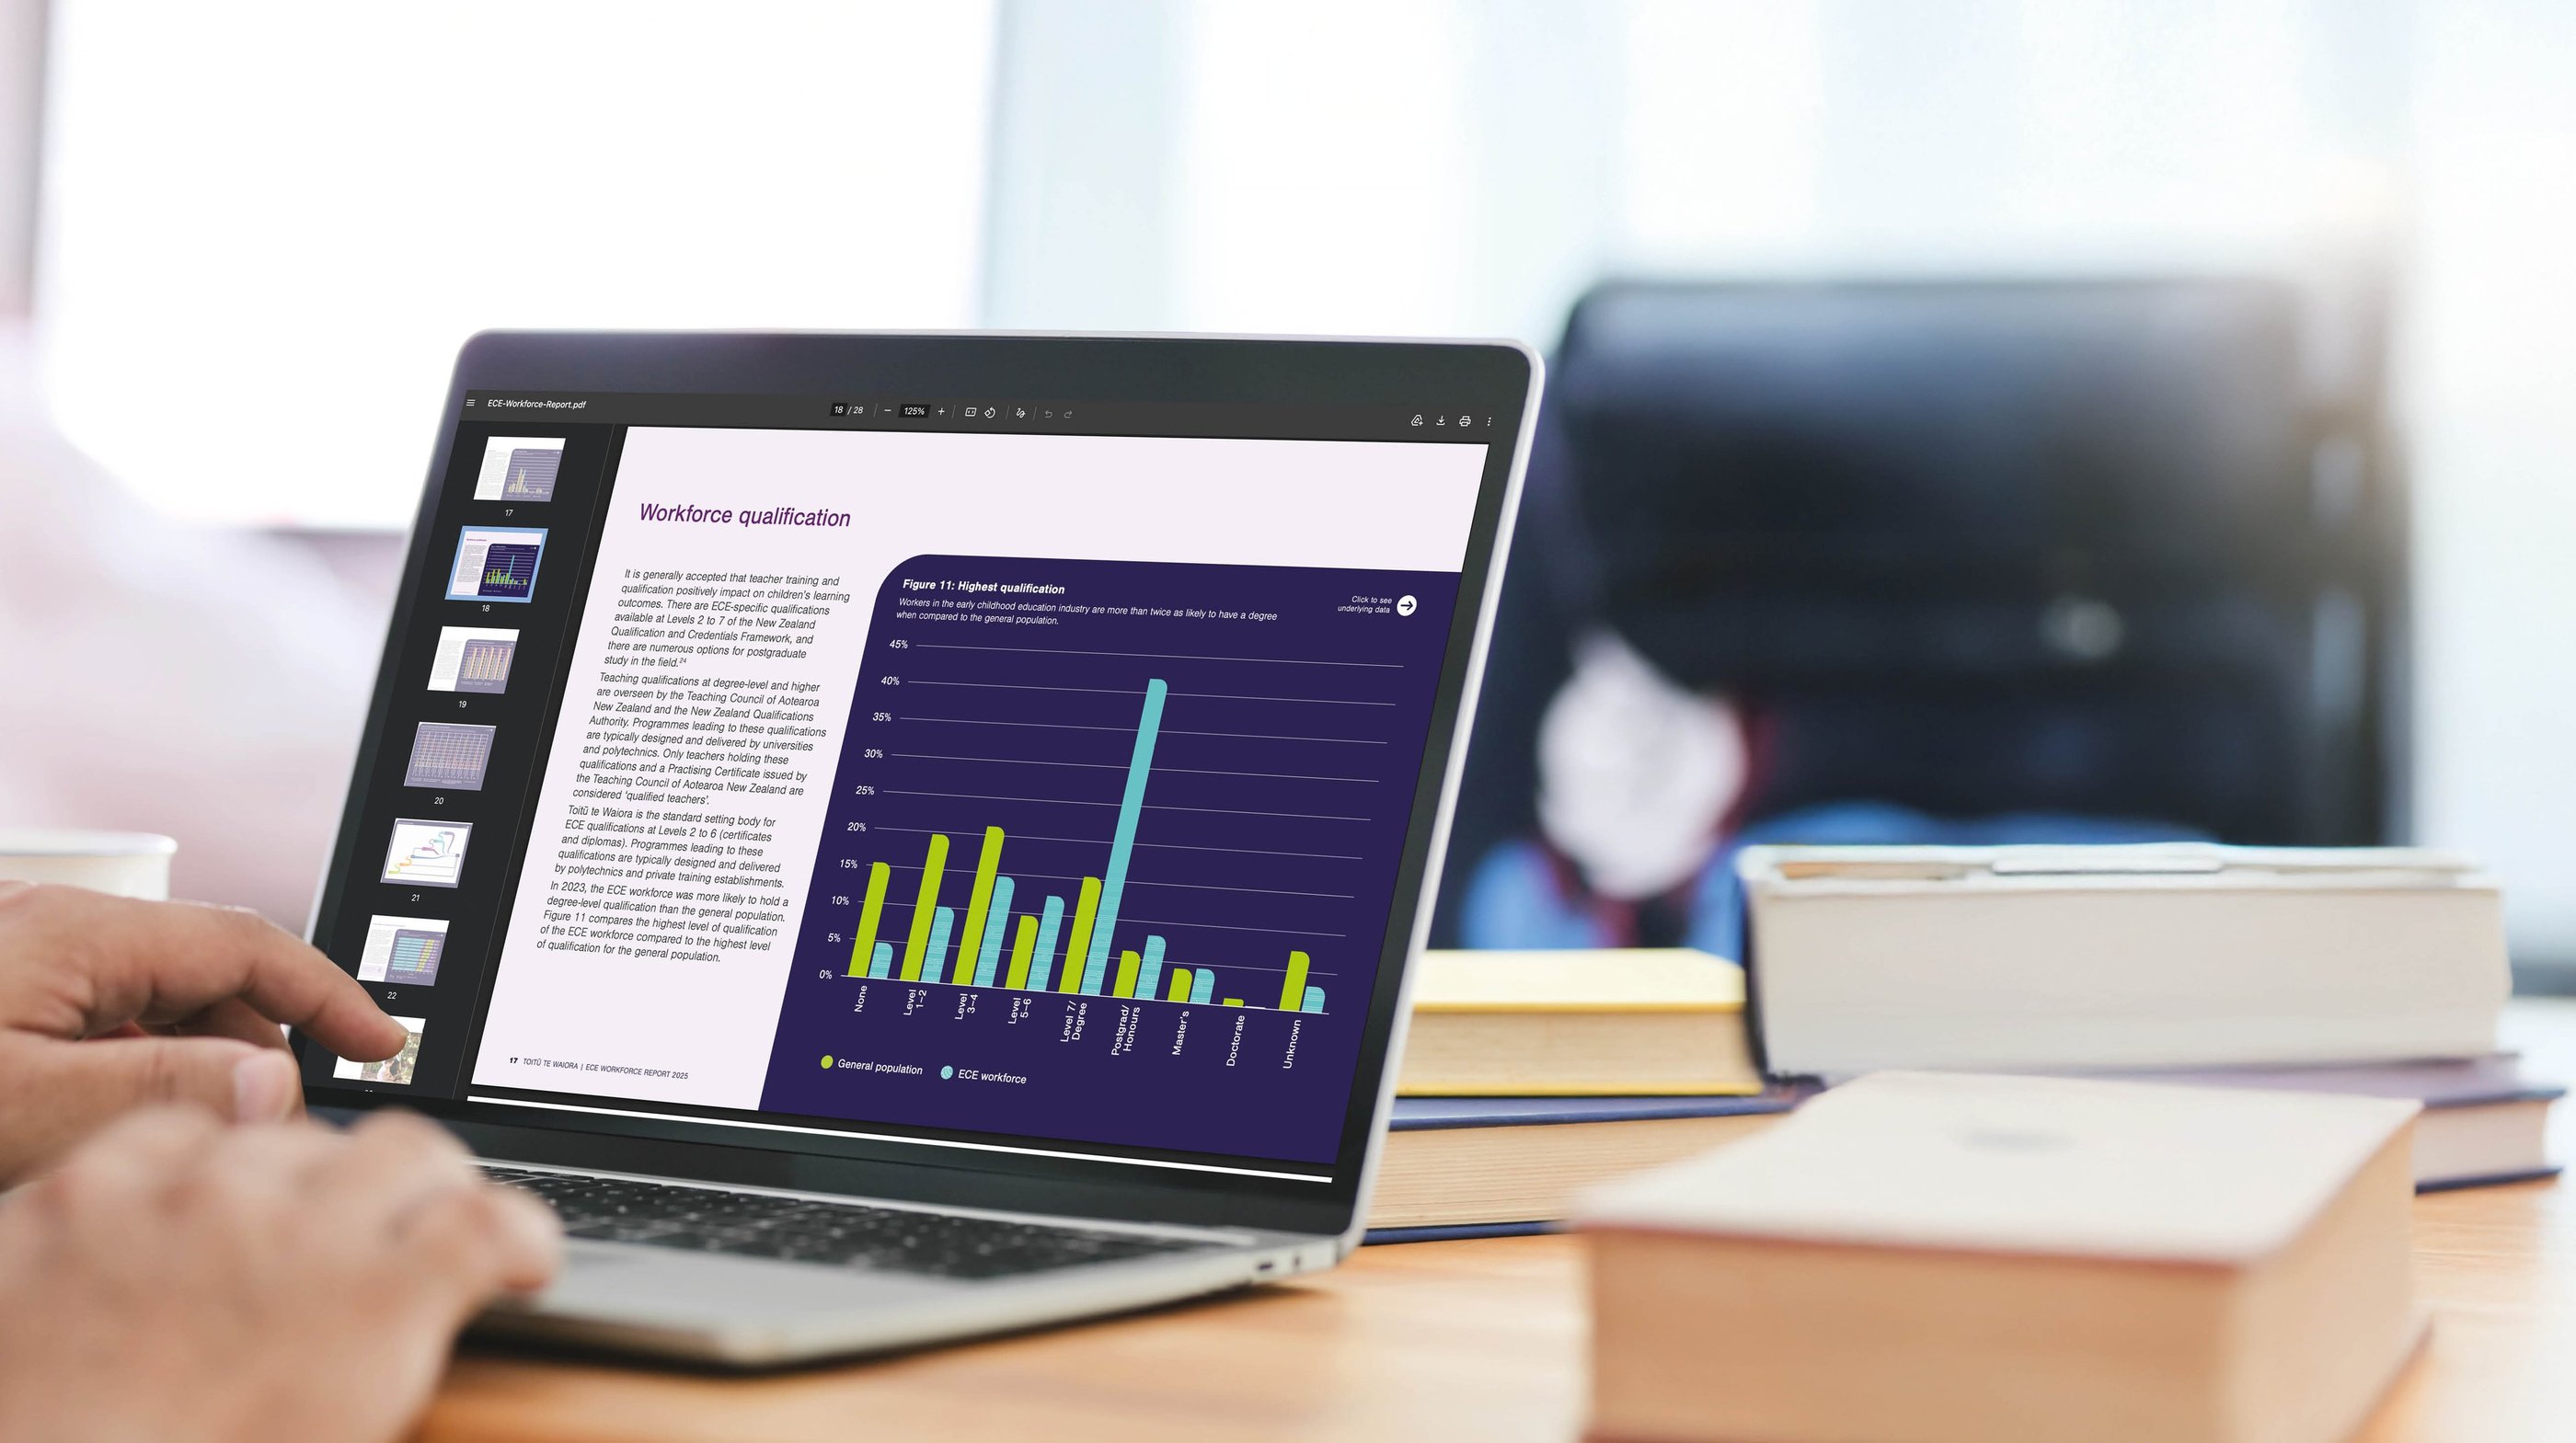
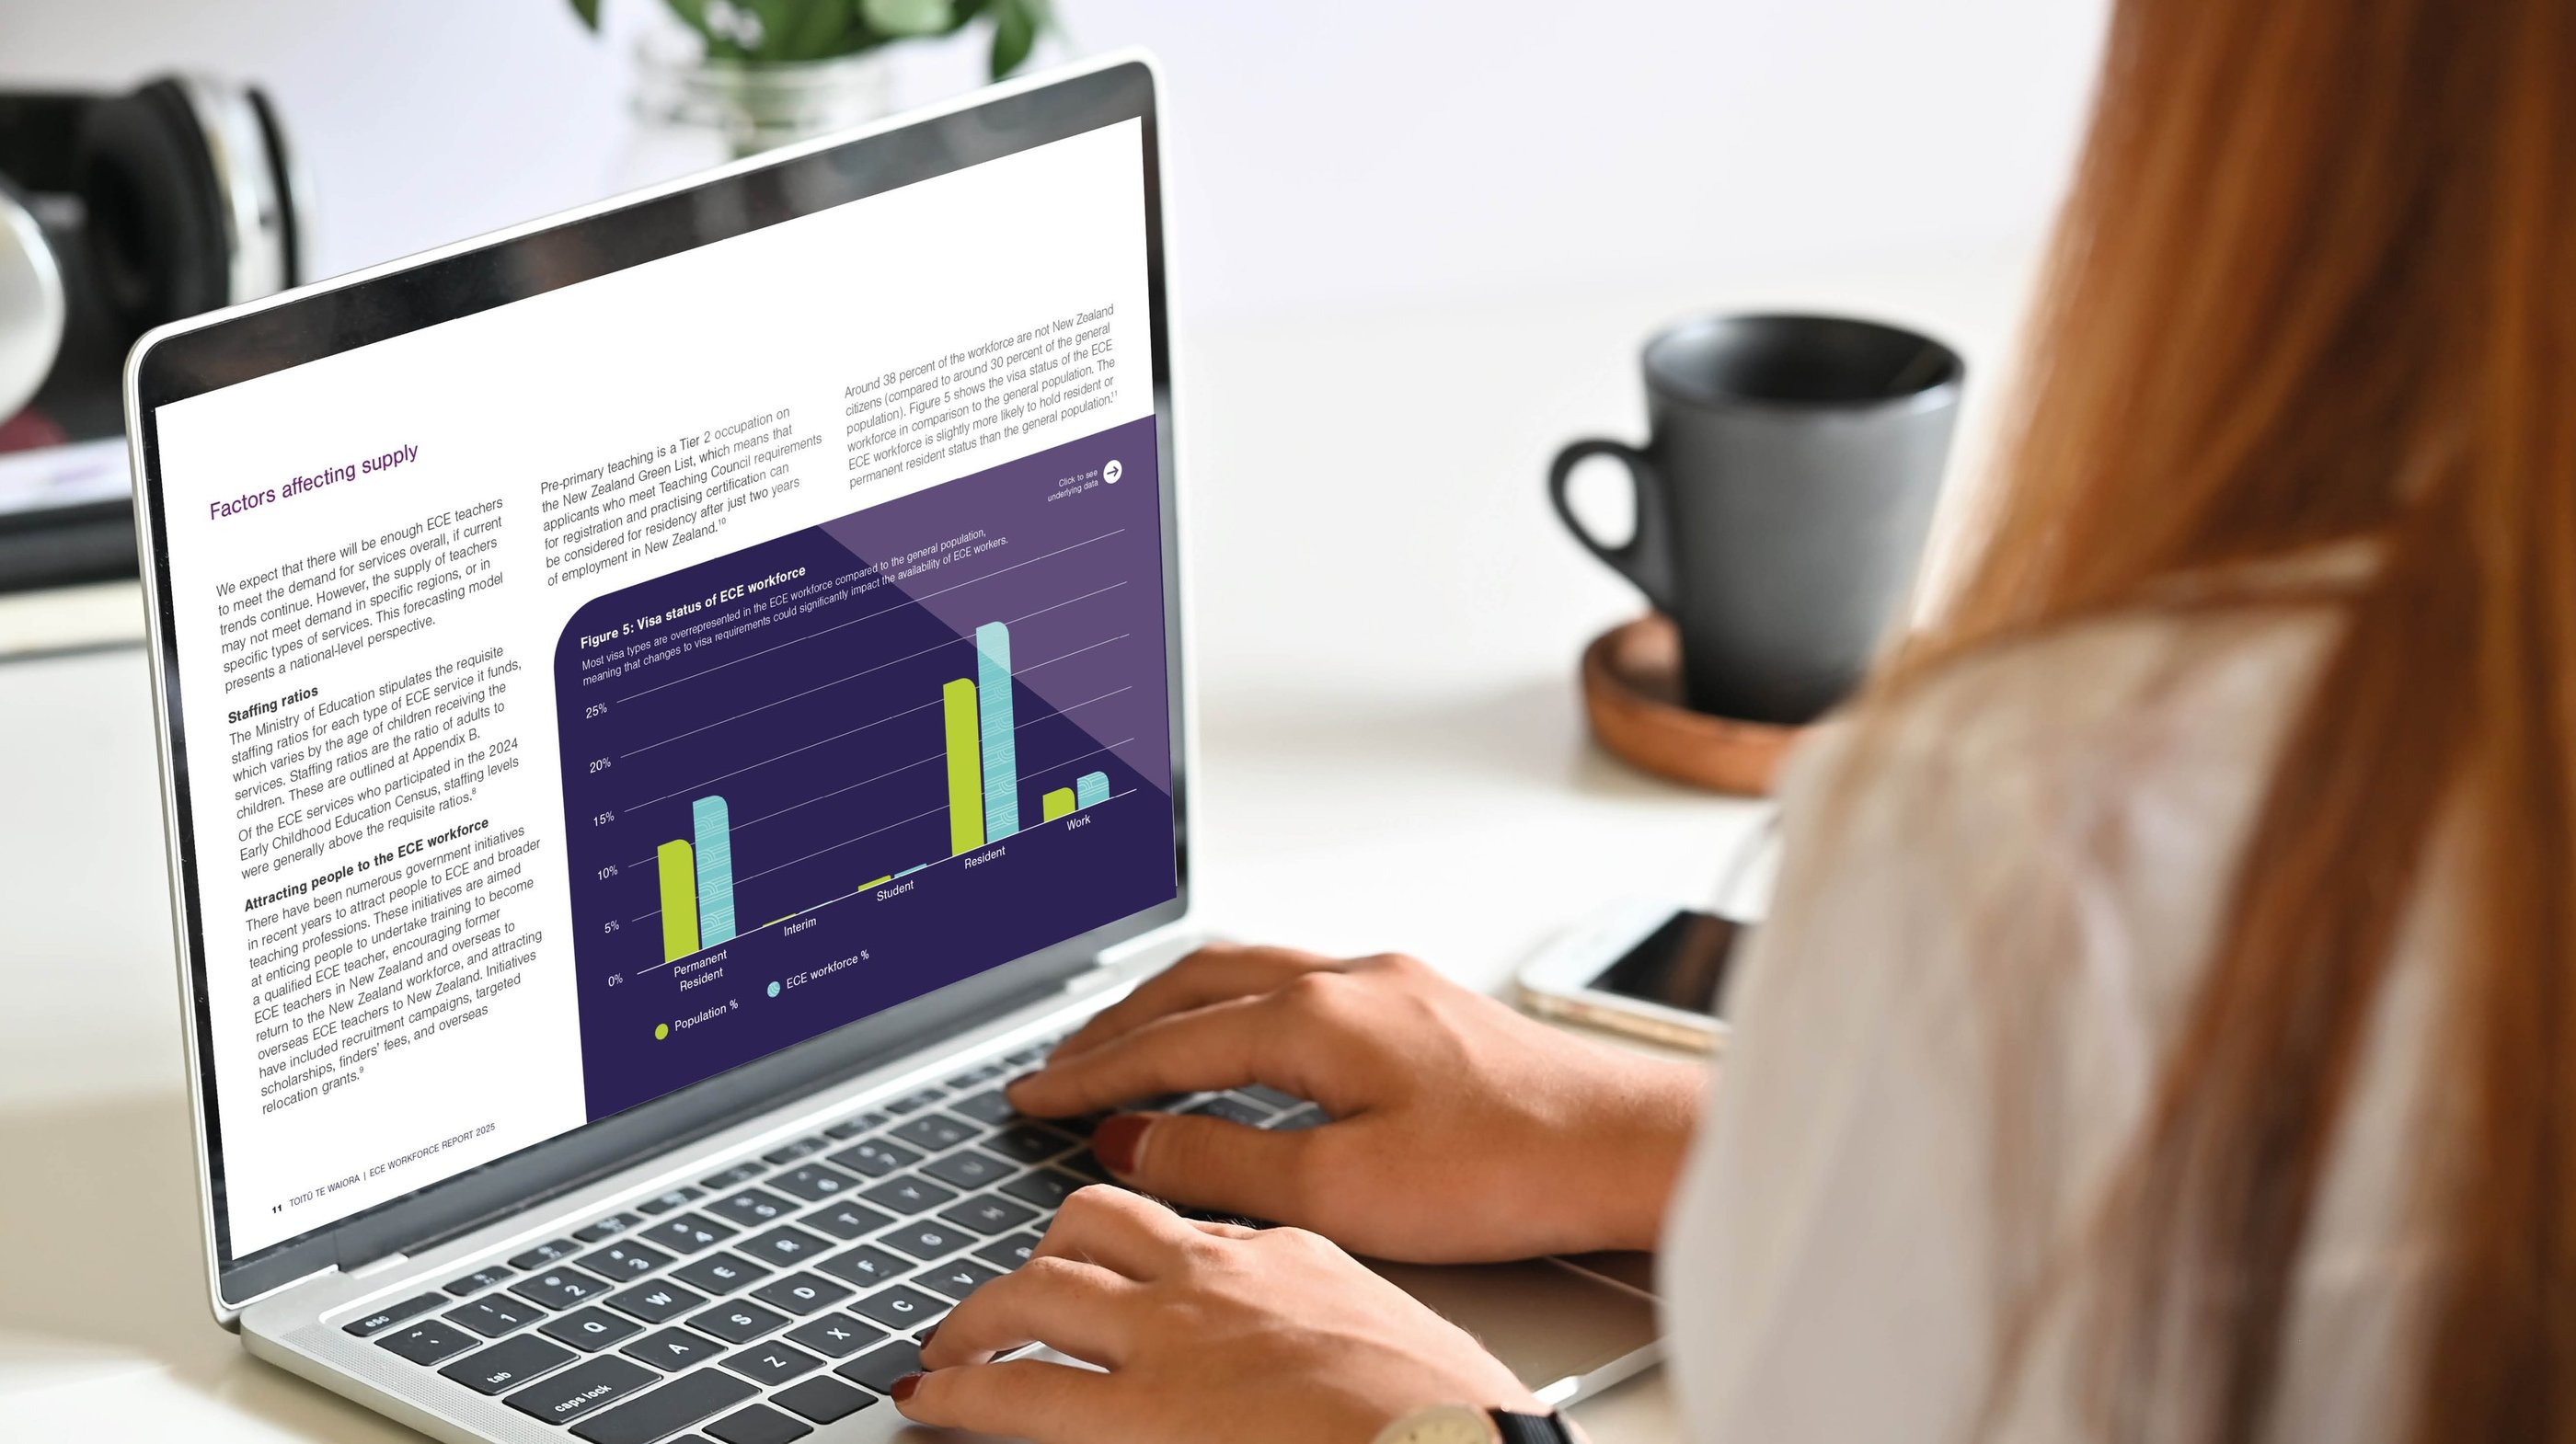
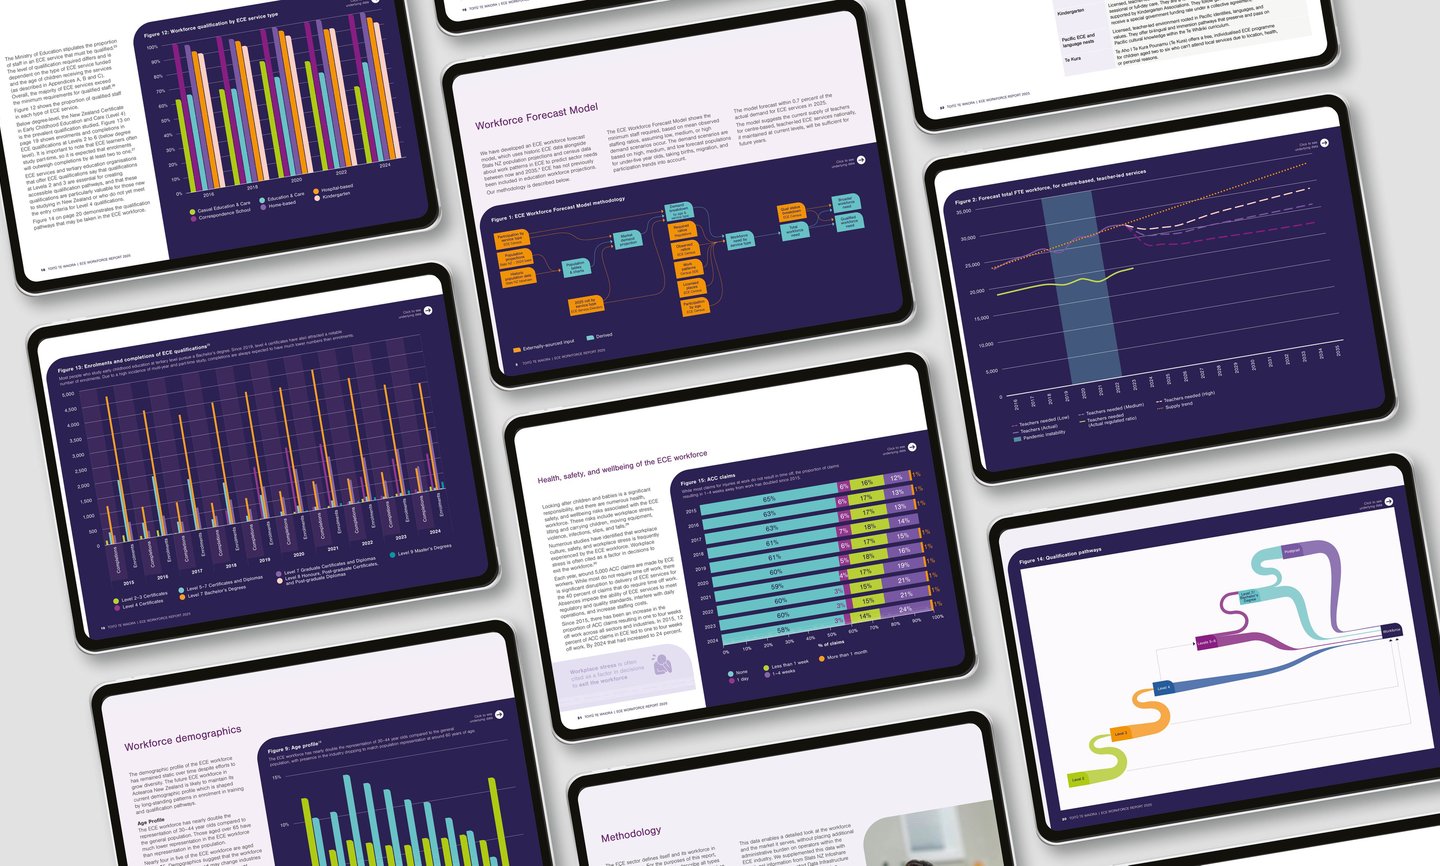
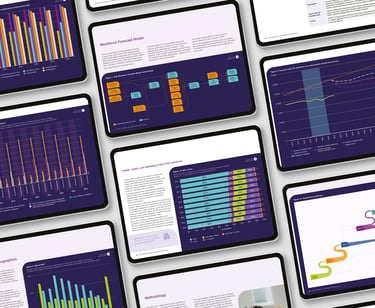
The challenge was to interpret a large and complex data set and to visualise this in a way that would effectively engage key stakeholders and the general public, facilitating clear communication. Working within an existing visual style added further constraints, requiring consistency while still improving clarity and usability. The project also operated under a tight timeline due to the client’s impending closure, the final stages were condensed, which placed additional pressure on delivery and decision-making.
My roles:
Leading in studying data sets, providing guidance on correct communication
Using existing styles to design document layout and specifications for interactive digital release
Liaising with clients to understand data and document hierarchy
Directly working with the client to identify the underlying needs behind the brief
Creating graph styles
Opportunity
To create a legible engaging system to understand large complex data sets for the audience to understand and in turn change behaviour.
The brief presented an opportunity to design a visual data system that could transform numbers into meaningful insight, aiming to support both comprehension and engagement. My role involved leading the analysis of data sets, guiding how information should be communicated, and collaborating closely with the client to determine the most effective visual approaches. Imagery of the workers and children evokes connection and highlights the importance of the work for the community.

Outcome
The final system allowed the client to clearly understand and share their insights, turning previously inaccessible information into a usable resource that influences understanding and encourages behavioural change. The client expressed strong appreciation for the outcome, and mentioned that the visualisations allowed them to have conversations about the data that they were not able to have before.